Platform intelijen bisnis yang kuat dan intuitif dengan dasbor seret-dan-lepas dan lebih dari 40 jenis grafik
Mapsly Analytics adalah platform intelijen bisnis swalayan modern yang siap digunakan untuk perusahaan. Platform ini cepat, intuitif, dan dilengkapi dengan berbagai opsi yang memudahkan pengguna dari segala tingkat keahlian untuk menjelajahi data Mapsly Anda menggunakan antarmuka yang sederhana. pembangun visual tanpa kode atau mutakhir IDE SQL, dan visualisasikan menggunakan 40 jenis grafik, dari diagram lingkaran sederhana hingga grafik geospasial yang sangat rinci.
Semua data Mapsly Anda, termasuk aktivitas rute, data check-in, data CRM Anda (termasuk objek kustom dan bidang kustom), Google Sheets, dan data yang didorong ke Mapsly melalui API Mapsly atau Zapier, langsung tersedia di Mapsly Analytics tanpa perlu integrasi tambahan atau pemetaan data.
Fitur Utama
Mapsly Analytics dilengkapi dengan fitur canggih yang memungkinkan pengguna dari semua tingkat keterampilan untuk menjelajahi dan memvisualisasikan data mereka.
Dasbor seret dan lepas
Buat grafik dan dasbor cantik yang kompleks dalam hitungan menit menggunakan pembangun visual seret dan lepas
40+ jenis grafik
Jelajahi pilihan lebih dari 40 grafik mulai dari diagram lingkaran dan garis sederhana hingga grafik geospasial dan corong yang kompleks
Penyaringan lanjutan
Gabungkan filter silang khusus grafik dengan filter dan variabel tingkat dashboard untuk membuat grafik yang terhubung
Tinjau perinci ke dan tinjau perinci dari
Dengan mudah beralih antara berbagai tingkat agregasi data dan dengan cepat mengakses catatan data yang mendasarinya
Kolom & dataset kustom
Tambahkan kolom kustom berdasarkan ekspresi SQL ke dataset Anda. Pra-agregasi data Anda dari satu atau beberapa sumber data dalam dataset virtual.
Akses SQL langsung
Akses tabel data Anda di semua sumber data Anda secara langsung menggunakan kueri SQL
Analitik untuk Tim Penjualan & Layanan Lapangan
Mapsly Analytics dilengkapi dengan dua konfigurasi yang telah ditetapkan dasbor yang memberikan tampilan 360º dari tim penjualan dan layanan lapangan Anda aktivitas dan kinerja. Anda dapat mengedit grafik yang ada dan menambahkan grafik baru ke dasbor ini untuk memenuhi kebutuhan khusus Anda dalam analitik. Dan karena data CRM Anda sudah dimuat sebelumnya ke dalam Mapsly Analytics, Anda dapat dengan mudah menggabungkannya dengan data routing Mapsly untuk wawasan yang lebih mendalam. Pelajari lebih lanjut di Pusat Bantuan Mapsly.
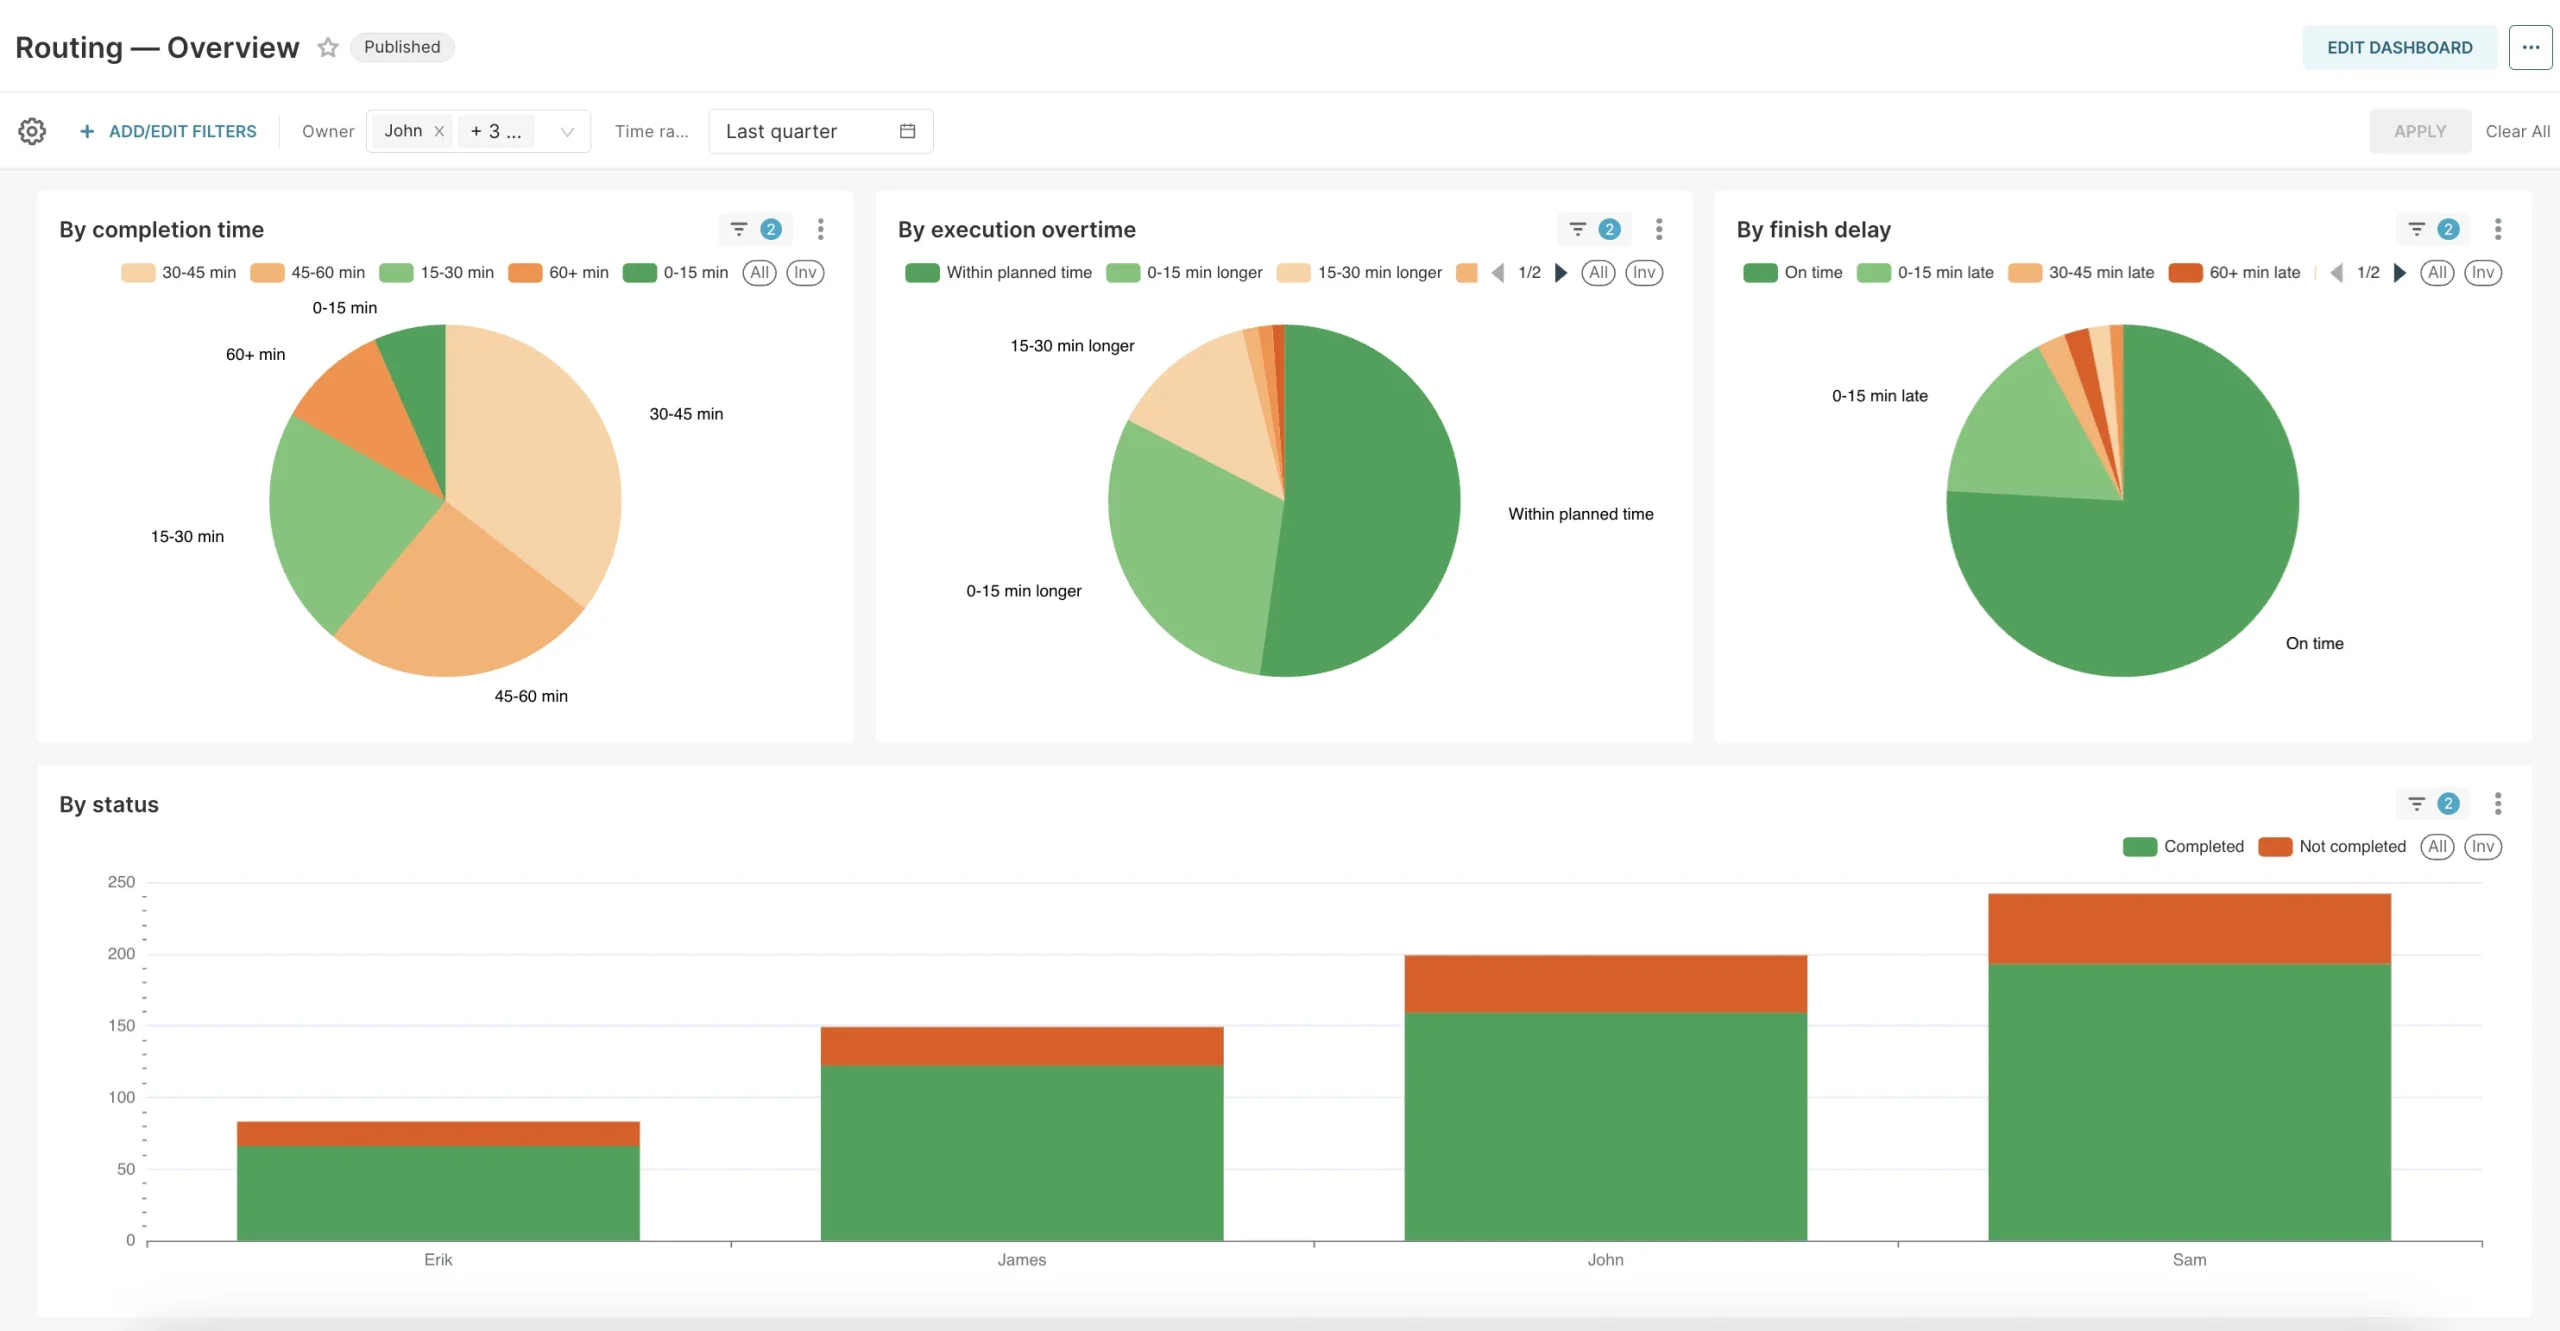
Perutean — Ikhtisar
Dalam Kunjungan bagian:
Total kunjungan yang direncanakan, dipecah menjadi Total selesaikunjungan dan Total kunjungan gagal;
Kunjungan hari ini dengan garis tren yang menunjukkan jumlah kunjungan per hari selama periode tersebut;
Total kunjungan berdasarkan status (seperti selesai, gagal, dan status aktivitas rute kustom Anda);
Total kunjungan selesai berdasarkan penundaan mulai: mulai tepat waktu, mulai dengan keterlambatan hingga 15 menit, mulai dengan keterlambatan 15-30 menit, …, mulai lebih dari 1 jam terlambat;
Total selesai berdasarkan jarak pengguna dari lokasi: pengguna berada di lokasi (jarak dalam 500m), pengguna berjarak 500-1000 meter dari lokasi, …, pengguna berjarak lebih dari 5 km dari lokasi.
Miliknya Rute bagian membandingkan direncanakan jarak dan waktu, berdasarkan rute harian pengguna, terhadap pergian jarak dan waktu yang dicatat menggunakan Mapsly’s pelacakan lokasi dan menampilkan total jarak dan waktu yang direncanakan yang dipisahkan menjadi komponen: waktu perjalanan, waktu menunggu, dan waktu kunjungan.
Informasi yang sama juga ditampilkan untuk setiap pengguna, beserta jumlah hari setiap pengguna melakukan perjalanan selama periode hari yang ditentukan.
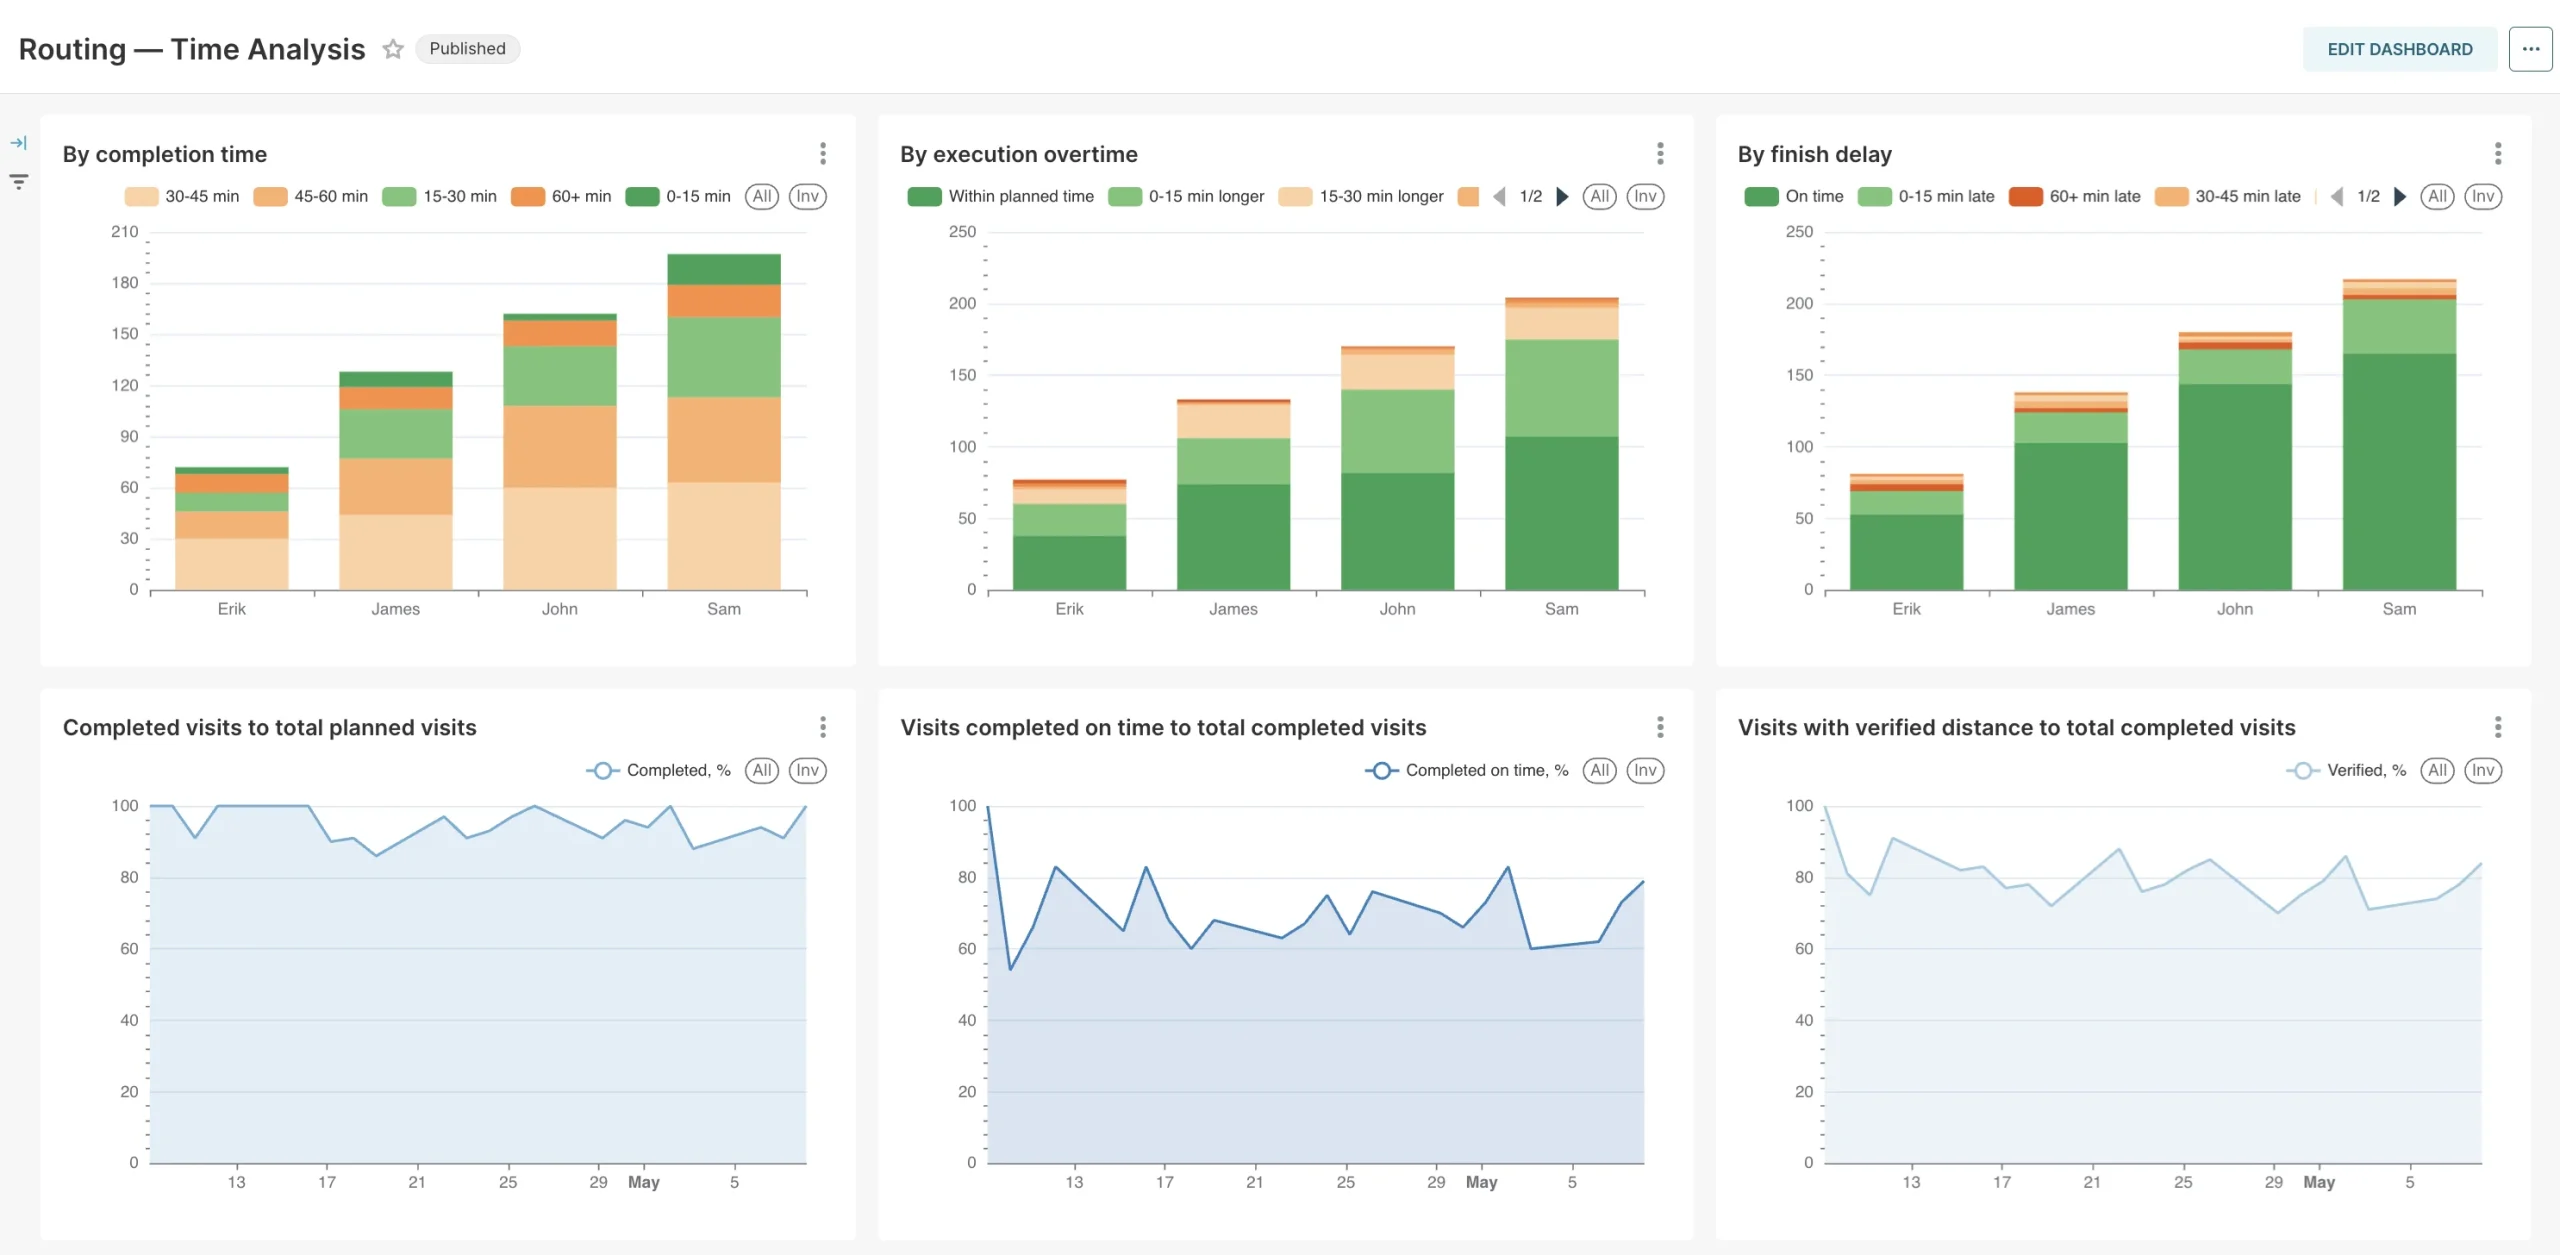
Perutean — Analisis Waktu
Dasbor ini menunjukkan bagaimana metrik yang disebutkan di atas berubah selama periode waktu yang ditentukan (misalnya, selama 6 bulan) dengan tingkat waktu yang ditentukan (misalnya, satu minggu), untuk pengguna yang dipilih — gabungan dan untuk setiap pengguna secara terpisah.
Buka Produktivitas 3X untuk Tim Anda:
Dapatkan Buku Panduan Lengkap Tim Lapangan Anda
Strategi dari tim lapangan berperforma tinggi untuk menghemat waktu, menangkap data sempurna, dan melakukan lebih banyak kunjungan setiap hari.
Harga Mapsly Analytics
Mapsly Analytics tersedia sebagai add-on di semua paket Mapsly dan dihargai per pengguna: $28 per pengguna yang dapat membuat dan mengubah dashboard yang ada dan $10 per pengguna hanya lihat..
Bagaimana Tekmetric Memberdayakan Tim Penjualan Lapangannya dengan Mapsly
Pelajari bagaimana Tekmetric menggunakan alat optimasi rute, prospeksi, dan pembersihan data dari Mapsly untuk meningkatkan jangkauan penjualan langsung dan melayani bengkel perbaikan mobil dengan lebih baik.